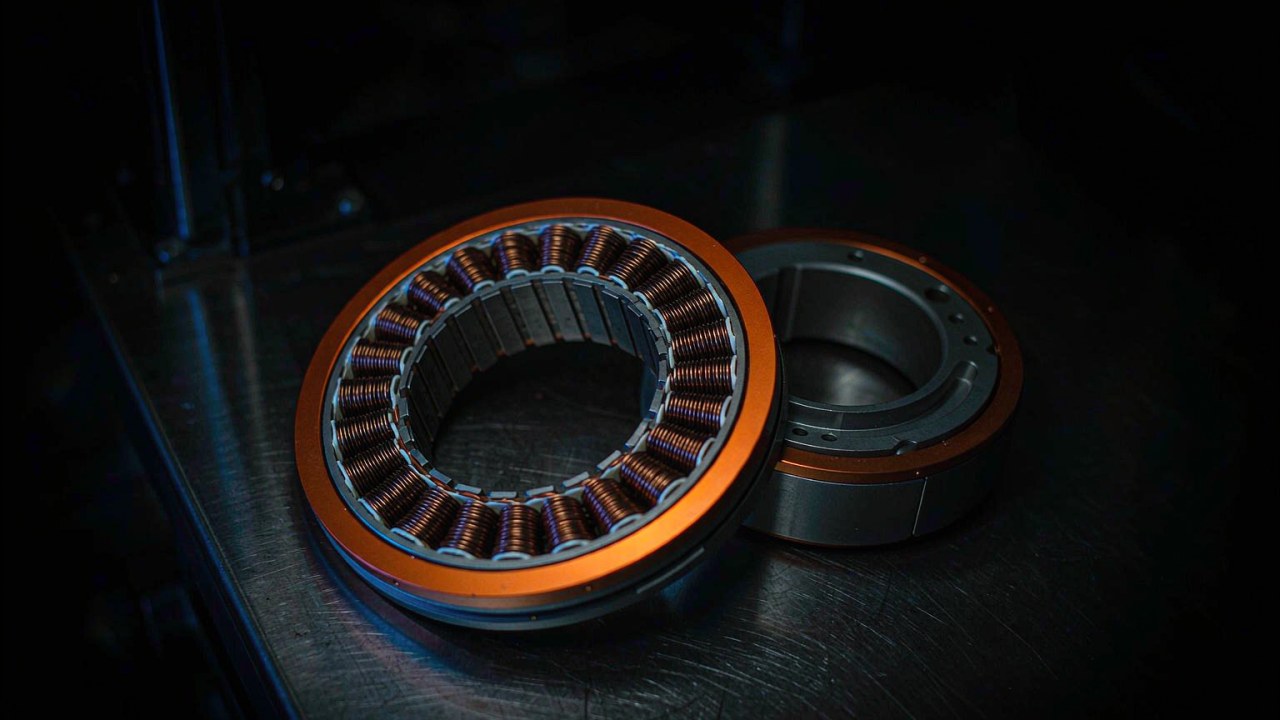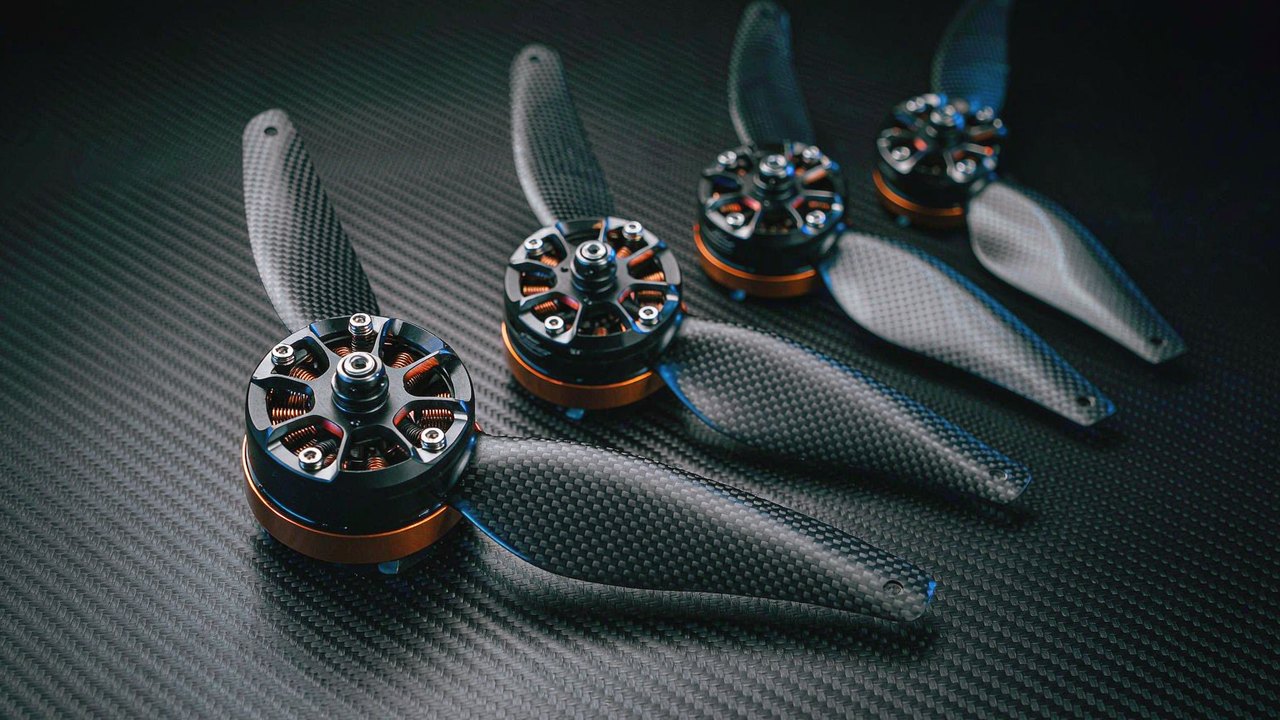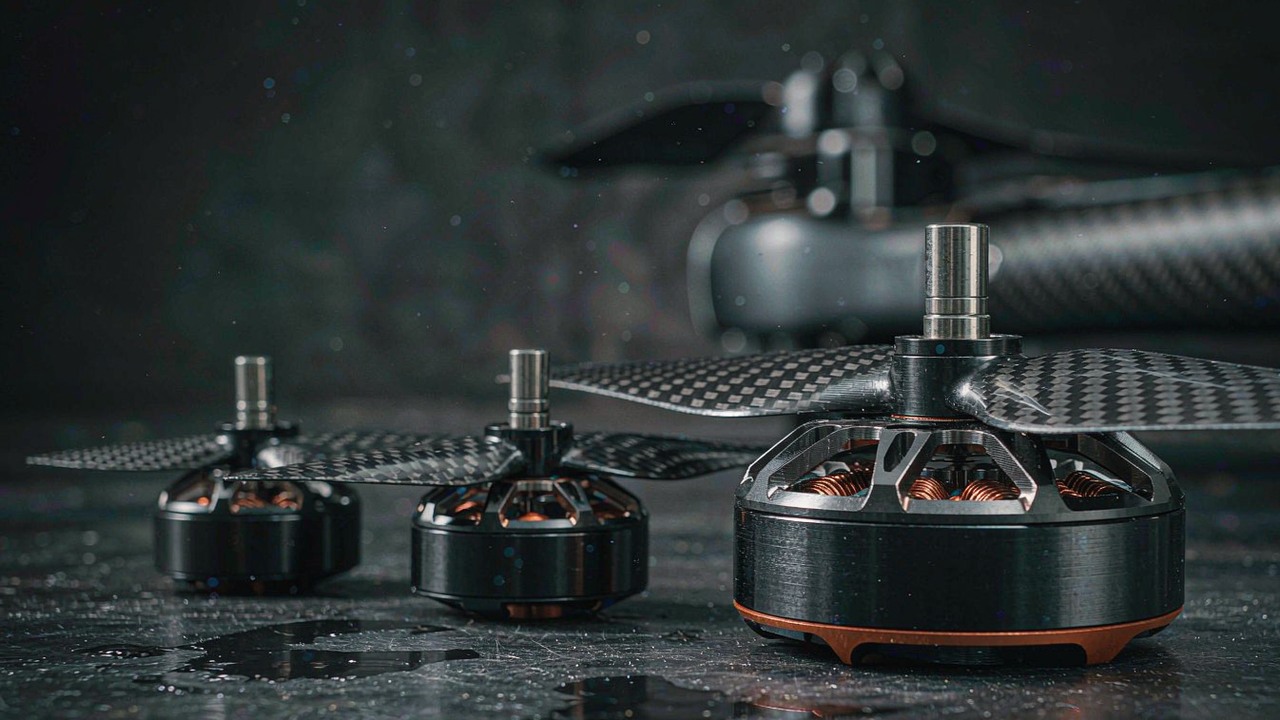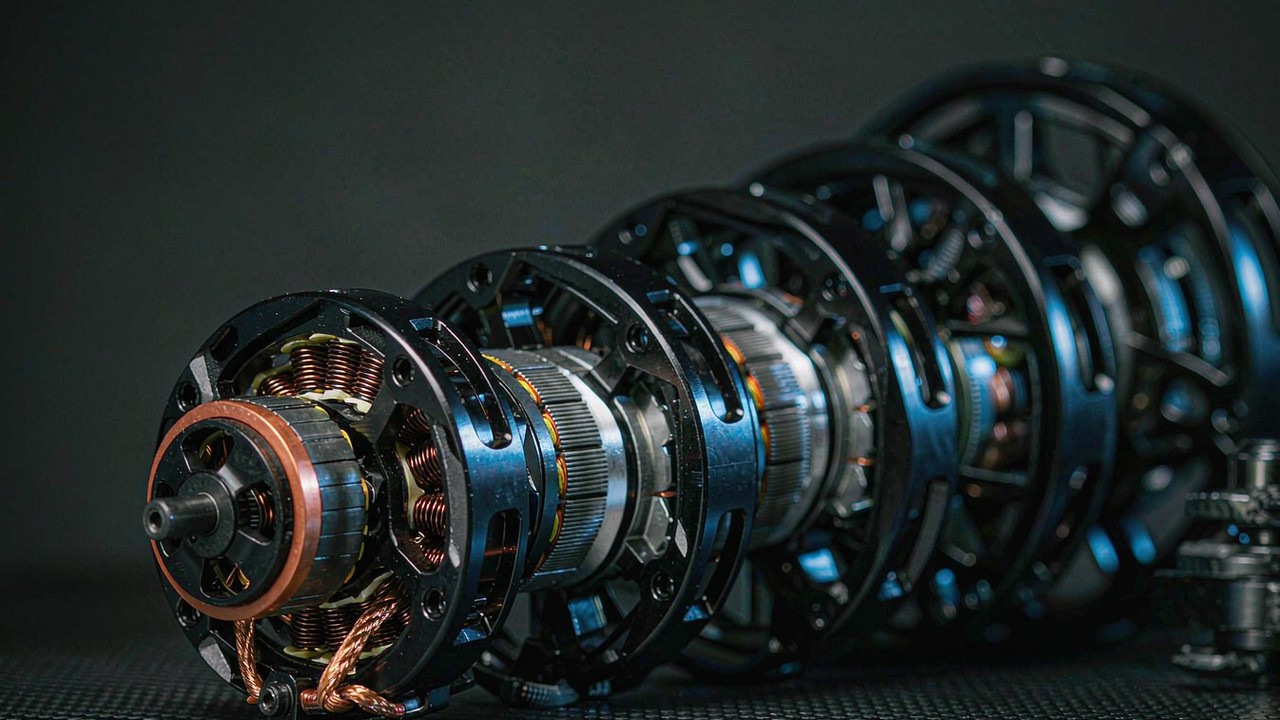
A BLDC Motor for Long Endurance UAV is chosen for the point the airframe actually spends its time at rather than for the peak it can survive for a moment, and the seven MN-series models currently listed in the UAV Motors category show how far apart those two requirements sit. Across the group the KV runs from 160 to 470, the mass from 68 g to 171 g, the internal resistance from 55 mΩ to 194 mΩ and the published 180 second power from 380 W to 1200 W. That spread has to answer for a sub-kilogram survey multirotor at one end and a multi-kilogram VTOL lift platform at the other, so the useful question is not which of the seven is the strongest, but which one holds its efficiency and its temperature at the hover point the mission is built around. This guide reads the seven records against that question, and the same duty is described on the Long Endurance UAV application page.
Quick Answer
Flight time is set by a chain rather than by a single column, and the chain runs from the propeller to the bus voltage to the winding. The propeller diameter and pitch fix the shaft speed and the torque the motor has to deliver; the cell count fixes the voltage the winding sees; and the KV joins the two, because KV is the ratio between shaft speed and applied volts. A long-endurance airframe wants the propeller to be large and slow and the bus to be high, so that the current the winding carries for the whole mission stays low, and the records in this group that are published for 6-12S and 12S are the ones built for that arrangement.
Two of the columns carry more weight than their width suggests. Internal resistance is the coefficient on copper loss, and copper loss is paid continuously for the entire flight rather than in bursts, so a resistance figure that differs by a factor of three between two candidates is a difference the mission will feel. The published 180 second power is a thermal window rather than a cruise rating, and it is best read as a margin signal between candidates of similar duty rather than as a number to substitute into a flight-time estimate. BLDC Motor for Long Endurance UAV selection therefore starts with the propeller and the all-up mass, moves to the bus and the KV, and only then compares the records column by column.
Where the seven records divide is at the bus rather than at the mass. Four of them are published for 6S or below and three for 6-12S or 12S, and the KV figures follow the same division, running from 340 to 470 KV on the lower-voltage records and from 160 to 240 KV on the higher-voltage ones. The two groups can reach comparable shaft speeds from different pack voltages, and the figure that separates them is the current each one draws for its published power. The sections below take that chain apart in order, then set the seven records side by side as one specification set.
Where flight time is actually lost
Flight time on a BLDC Motor for Long Endurance UAV is not lost because the motor is inefficient in the abstract; it is lost at a specific operating point, and that point is the hover. Everything downstream of the hover point - the size of the pack that has to be carried, the climb that has to be budgeted, the reserve that has to be held - is derived from the power the aircraft needs to stay in the air. That is why a long-endurance shortlist is written around hover efficiency and thermal behaviour rather than around the largest published power figure in a product range.
The hover point is where a mission is spent
A survey or inspection flight climbs once, settles, and then holds altitude for the great majority of its duration, so the electrical power drawn at that steady state is the figure that sets endurance. Peak power is drawn for seconds during the climb and is bounded by the ESC and the pack rather than by the winding. The consequence for a shortlist is direct: two motors with identical published peak power can sit far apart at the hover point, and the one that is better at the hover is the one that matters for a long mission. It is also the reason the 180 second column cannot substitute for hover data, and the reason the sections below separate the two figures wherever a comparison depends on the difference.
Disk loading is a propeller decision before it is a motor decision
The power a multirotor needs to hover at a given all-up mass falls as the disk area under it grows, and disk area is a property of the propellers rather than of the motors. A larger rotor on the same airframe accelerates a larger mass of air to a lower velocity, which produces the same thrust for less induced power. The motor enters the picture only as the component that has to turn that larger rotor at a workable speed and without overheating, which is why the low-KV records in this group are also the ones published for the highest cell counts: a large, slow propeller needs a low shaft speed per volt, and a high bus is what delivers the required shaft speed without a high KV.
Endurance is thrust per watt, not watts
The figure that describes hover economy is the thrust returned for each watt of electrical input, and the manufacturer publishes it directly. The test data for the MN3510 KV360 on a 15 × 5 CF propeller at 14.8 V runs from 340 g of thrust at 15.32 G/W at 50 percent throttle, through 580 g at 13.06 G/W at 65 percent and 760 g at 11.41 G/W at 75 percent, to 1000 g at 9.94 G/W at full throttle. On one motor and one propeller, the 50 percent point therefore returns about 1.5 times the thrust per watt of the full-throttle point. Long endurance UAV efficiency is bought at the part-throttle end of that curve, which is exactly where an aircraft that is not climbing spends its time, and it is the reason a shortlist read against a peak-power column can point the wrong way.
Resistance, current and the heat a long mission has to live with
Copper loss is the current squared multiplied by the winding resistance, and every term in that product behaves differently over a long flight. The current is set by the propeller and the bus; the resistance is a property of the winding; and the loss that results is converted into heat inside a stator that has no active cooling and only whatever airflow the airframe provides. Over a twenty-minute sortie the loss accumulates continuously, so the UAV motor internal resistance figure is a coefficient on a running cost rather than on a momentary one, and long endurance UAV efficiency is what the two terms decide together over a full discharge.
Resistance is a loss that runs for the whole mission
Because the loss scales with the square of current, its value is decided mostly by where the hover current sits, and the hover current is decided by the propeller load and the bus voltage. In this group the resistance runs from 55 mΩ on the MN5008 KV340 to 194 mΩ on the MN4006 KV380, a factor of roughly three and a half across records of comparable published power. Read next to the bus column, that ordering is largely explained: the higher the cell count, the lower the current required for a given shaft power, and the less the resistance term costs. A candid reading of a Long Endurance UAV shortlist has to use the two columns together, because a high resistance on a low-voltage record and a low resistance on a high-voltage record are not measuring the same duty.
The idle current line, and what it costs over an hour
Idle current is the current the motor draws with no propeller load, and it covers the losses that do not come from the load at all - bearing drag, windage and the iron losses in the stator. Those losses are present whenever the motor turns, so over an hour they are a fixed tax on the pack. The column is published unevenly in this group, and it is published at different reference voltages, which is a limitation worth stating plainly: the MN4006 KV380 is listed at 0.3 A and the MN5008 KV340 at 0.9 A, both at 10 V, while the MN6007 II KV160 is listed at 0.5 A at 18 V. The remaining four records in the group do not carry the field, so no like-for-like no-load ranking across all seven can be made from the records; where a build depends on the no-load loss, the figure belongs in the questions put to the manufacturer’s documentation.
A stator that stays cool keeps its efficiency margin
Copper resistance rises with temperature, so a winding that runs hot at the hover point is a winding whose losses grow through the flight and whose available margin shrinks with them. That makes thermal behaviour a first-order property of a long-endurance motor rather than a secondary one, and it is the part of the duty that the published tables describe least directly. The manufacturer’s own test note is explicit about the condition behind its temperature column: the figure is the motor surface temperature at 100 percent throttle after the motor has run for 10 minutes. A steady hover at part throttle is a different thermal case from ten minutes at full throttle, so the temperature data is evidence about how the design manages heat rather than a prediction of hover temperature, and the mounting and ambient assumptions behind it stay with the manufacturer’s documentation.
What a long mission asks that a short one does not
A short flight and a long flight read the same specification table differently, and the difference is not only the duration. A long mission exposes the winding to a sustained current and a sustained thermal load, it drains the pack far enough to move the bus voltage under the motor, and it leaves no room for a component whose published numbers only hold at the beginning of the discharge curve. Those three effects are the reason the columns that matter shift between the two duties.
What the 180 s column is actually measuring
The published 180 second power is the power the motor can absorb for 180 seconds before reaching the thermal limit set by its insulation class and its mounting, and the manufacturer states the temperature convention that sits behind it. It sits between a climb and a sortie: longer than any take-off burst, far shorter than a flight. Its useful role in a long-endurance shortlist is comparative - a 1200 W record against a 380 W record is a real difference in how much current the winding can carry before the limit is reached, and in how much margin a heavier airframe has if the hover point moves. It is not a figure to divide into pack energy, and the sections above show why: the thrust per watt at the hover point, not the thermal ceiling, is what converts stored energy into time in the air.
Duty over time, and why a peak number cannot stand in for it
A mission has a shape, and the shape is what a winding experiences. A climb of tens of seconds, a hover of many minutes, a repositioning leg and a descent each present a different current, and only the hover segment lasts long enough to matter for thermal steady state. The specification table carries no column for that profile, which means the comparison has to be assembled from the parts that do exist: the hover point efficiency from the test data, the resistance that turns hover current into heat, and the published figures for the ends of the range. Reading a shortlist by the largest number in the power column substitutes an extreme for a distribution, and it is the most common way a long-endurance selection is made on the wrong basis.
Voltage sag late in the pack
A pack that has delivered most of its capacity sits at a lower voltage than a full one, and the motor sees that directly, because KV converts volts into shaft speed. Late in a flight the shaft speed available at a given throttle therefore falls, and holding the same thrust takes more current - which raises copper loss at exactly the moment the pack has least margin to give. The records describe this only through the cell-count column, and that is one reason the count is worth reading as part of the duty rather than as a packaging detail. A build whose whole flight is planned against the full-pack voltage is planning against the top of a curve that slopes downward.
Mass, and the battery capacity it displaces
On a BLDC Motor for Long Endurance UAV, mass is not free: it is paid for out of the two budgets that decide endurance, payload and pack. Every gram added at the motor has to be lifted for the whole flight, which raises the hover power and therefore draws down the pack faster; the same gram taken out of the pack removes stored energy. The trade is real and it is measurable, which is why the mass column belongs next to the efficiency columns rather than in a mechanical appendix.
Motor mass is paid out of payload or pack
The seven records span 68 g to 171 g, and the span is not accidental: the lighter records are the low-voltage ones carrying less copper, and the heavier records carry the winding and the magnet material that a higher-thrust duty needs. Placing a heavier motor on an airframe does not simply add its own mass, because the extra thrust capability may allow a larger propeller or a shorter climb, which can pay some of the mass back. What it cannot do is escape the arithmetic of hover: at a fixed all-up mass, a heavier propulsion set leaves less for the pack, and the pack is the endurance budget. The mass column is therefore read last in the sequence below, but it is read against the efficiency columns rather than in isolation.
Mass without the cable is what the airframe carries
Two mass conventions exist in the records and they are not interchangeable. The figure in the table below is the published weight including the cable and connector; a separate figure for the motor alone is published for only three of the seven records, at 80 g on the MN3110 KV470, 97 g on the MN3510 KV360 and 150 g on the MN4014 KV400. Those three show that the cable and connector account for a meaningful share of the published weight, between roughly 12 and 18 percent of the total on those records, so a mass budget built on the table value is conservative in the right direction. No allowance is made here for a no-cable figure on the four records that do not publish one, and none is estimated.
Bus voltage and the propeller the motor has to turn
On a BLDC Motor for Long Endurance UAV, cell count and KV are frequently treated as separate decisions when they are two halves of one ratio. KV converts applied volts into shaft speed, so the bus voltage and the KV figure multiply together to place the no-load speed; the propeller then decides how much of that speed survives under load and how much current the motor draws to turn it. Reading the two columns apart is what produces builds that are individually reasonable and jointly mismatched.
Cell count and KV are two halves of one ratio
Because no-load speed scales with KV at a fixed bus, the ratio of two KV figures is the ratio of their shaft speeds on a common pack. In this group the MN3110 KV470 and the MN6007 II KV160 sit at the extremes, at 470 KV on 3-6S and 160 KV on 12S, and the ratio between them - close to three to one - is the whole reason the two ends of the table are not interchangeable. The same shaft speed can be reached by a high-KV motor on a low cell count or a low-KV motor on a high cell count; what changes is the current. Holding shaft power constant, raising the bus lowers the current, which lowers the copper loss in the winding and the current the ESC has to source.
Lower KV, larger propeller, lower disk loading
A larger propeller is a longer lever on the shaft and needs more torque at a given speed, and torque in a brushless motor is produced by current. So a large, coarse propeller on a low-KV motor is a matched pair, and the same propeller on a high-KV motor would demand either a lower throttle setting - moving the operating point away from its efficient region - or a current the winding is not sized for. That is the mechanical half of the argument the hover section makes on the electrical side, and it explains the ordering of the group: the KV figures fall as the published thrust rises, from 470 KV on the lightest record to 160 KV on the heaviest-thrust one. Long endurance UAV efficiency and disk loading are connected through that ordering, not through the power column.
BLDC Motor for Long Endurance UAV: Spec Comparison Matrix
The seven records currently listed in the UAV Motors category are set out below as one specification set, ordered by published mass so that the step from the lightest record to the heaviest is visible in the column itself. Every value is the figure the manufacturer publishes for that model, and no cell is estimated. Where a record does not carry a field, the table says so rather than filling the gap. The same seven models are the ones grouped under the Long Endurance UAV duty discussed in the sections above.
| Model | Configuration | Internal Resistance | No. of Cells (LiPo) | Maximum Thrust | Max Power 180 s | Weight |
|---|---|---|---|---|---|---|
| MN4006 KV380 | 18N24P | 194 mΩ | 4-6S | 2309 g | 380 W | 68 g |
| MN3110 KV470 | 12N14P | 135 mΩ | 3-6S | 1220 g | 330 W | 98 g |
| MN3510 KV360 | 12N14P | 188 mΩ | 3-6S | 1900 g | 330 W | 117 g |
| MN5008 KV340 | 24N28P | 55 mΩ | 6S | 4215 g | 760 W | 135 g |
| MN6007 II KV160 | 24N28P | 178 mΩ | 12S | 6419 g | 1120 W | 159 g |
| MN501-S KV240 | 24N28P | 85 mΩ | 6-12S | 4660 g | 1200 W | 170 g |
| MN4014 KV400 | 18N24P | 67 mΩ | 4-8S | 3360 g | 900 W | 171 g |
Model, stator configuration, internal resistance, published cell count, maximum thrust, 180 second maximum power and weight as published by the manufacturer for the seven MN-series models currently listed in the UAV Motors category, ordered by published weight. Maximum thrust and 180 second power are the figures the manufacturer publishes for each model; both depend on the propeller and the bus voltage used in the test, so they are comparable within the group only in the sense that they describe each model’s own published condition. The cell count is shown as published, so a single figure means a single published window and a range means that model is published across the range. Weight includes the cable and connector. No KV column appears because every model name in the table carries its own KV figure, and no envelope column appears because the duty described here turns on the electrical columns rather than on body dimensions.
Two readings stand out once the seven are on one page, and neither is the power column. The first is that UAV motor internal resistance does not run in the same order as mass: the MN5008 KV340 carries 55 mΩ at 135 g, while the MN3510 KV360 carries 188 mΩ at 117 g and the MN4006 KV380 carries 194 mΩ at 68 g. Read down that column, the two lightest records are the ones with the highest resistance, which is what a winding sized for a light airframe looks like, and the 24N28P bodies in the middle of the table are the ones with the low figures. A shortlist built on the mass column alone would place those records in the wrong order for a long, steady flight.
The second is that the cell count divides the table in two. Three records are published for 6-12S or 12S and four for 6S or below, and the KV figures follow that division: the four lower-voltage records run from 340 to 470 KV and the three higher-voltage records from 160 to 240 KV. Because KV is rpm per volt, the two groups reach comparable shaft speeds from very different pack voltages, and the figure that separates them is the current each one draws for its published power. That is the reading the sizing sequence below turns into a decision.
A third reading concerns the records that sit closest together in the table. The MN501-S KV240 and the MN4014 KV400 are adjacent in mass at 170 g and 171 g, but they are built for different ends of the duty: one is a 24N28P 6-12S record at 1200 W and the other an 18N24P 4-8S record at 900 W. Adjacent mass with a different stator, a different bus window and a different published power is the clearest reminder in the table that mass is a packaging outcome rather than a description of duty. Choosing between them turns on the bus the airframe can carry and on the propeller each is meant to turn, not on the 1 g that separates them.
Seven records against three platform mass bands
The table sorts by weight, which is the right order for a shortlist and the wrong order for understanding what the group contains. Read by platform instead, the seven BLDC motors for long endurance UAV duty currently listed in the UAV Motors category fall into three bands, and the band boundaries are set by the take-off mass of the airframe rather than by the motor. The three sections below place each record where it belongs and note what the records do not say.
Platforms under 2 kg and what the records leave open
The light end of the group is carried by three records that were built for small camera platforms. The T-Motor MN4006 KV380 UAV Motor is the lightest at 68 g, an 18N24P 4-6S record publishing 2309 g of thrust and 380 W; the T-Motor MN3110 KV470 UAV Motor is a 12N14P 3-6S record at 98 g publishing 1220 g and 330 W; and the T-Motor MN3510 KV360 UAV Motor is the 117 g 12N14P 3-6S record publishing 1900 g and 330 W. The two 12N14P records illustrate why a thrust figure needs its test condition attached: the manufacturer’s published curve for the MN3510 KV360 reaches 1000 g on a 15 × 5 CF propeller at 14.8 V, so its 1900 g record value belongs to a higher bus within its 3-6S window. What the records leave open for this band is the hover-current figure at a specific propeller and bus, which is the number a sub-2 kg endurance budget needs and which is not carried as a column.
An official release video for the Navigator MN series, which covers the lighter records this guide draws on and shows how the 12N14P and 18N24P bodies in the first two bands are built and mounted.
ToBMS video pageWatch on YouTubeThe 2-5 kg mapping and inspection band
Two records cover the middle band, and they are the ones whose stator construction puts them closest to a dedicated long-endurance duty. The T-Motor MN4014 KV400 UAV Motor is 171 g in an 18N24P body publishing 3360 g and 900 W across a 4-8S window; the T-Motor MN5008 KV340 UAV Motor is 135 g in a 24N28P body publishing 4215 g and 760 W on 6S. The two differ in the direction that matters for this duty: the MN5008 KV340 carries 55 mΩ of resistance against the MN4014 KV400’s 67 mΩ, and its published cell count is a single 6S rather than a 4-8S window. A mapping platform that has settled on a 6S pack and wants the lower copper loss is reading the MN5008 KV340; a platform that wants the bus to be a free variable across the build, or that needs the higher published power, is reading the MN4014 KV400. The difference between 135 g and 171 g is 36 g of airframe mass, which is a fraction of the payload either one can lift and a real fraction of a small pack.
The 5-10 kg long-endurance and VTOL lift band
The heavy end of the group is filled by two records that differ from everything below them in the table. The T-Motor MN501-S KV240 UAV Motor is a 24N28P 6-12S record at 170 g publishing 4660 g and 1200 W; the T-Motor MN6007 II KV160 UAV Motor is a 24N28P 12S record at 159 g publishing 6419 g and 1120 W, the highest published thrust in the set. Both carry a wide or high bus window and a low KV, which is the combination a large, slow propeller needs, and both would suit the lift role of a VTOL platform as readily as a hover role on a multirotor. The MN6007 II KV160 pairs the highest published thrust with the second-highest resistance at 178 mΩ, which is what a high-KV-per-thrust ratio looks like in a low-KV winding: fewer turns of heavier wire does not follow from thrust alone, and the resistance column is where that shows.
Selecting a BLDC Motor for Long Endurance UAV: A Sizing Sequence
The order below is the order in which the published figures become decisions, because each step removes candidates that a later step cannot bring back. It is written for a shortlist drawn from the seven records currently listed in the UAV Motors category, but the sequence itself does not depend on which records are in the group. The Long Endurance UAV application page holds the same seven models with their filter attributes.
Duty and hover budget first
The mission profile is settled before any motor is read: the hover duration, the climb, the payload and the reserve together give the energy the pack has to hold and the hover power the airframe has to produce. Those two numbers then bound the search, because a motor whose published figures cannot support the hover power at an efficiency the pack can afford will not be rescued by any later step. Across this group the published 180 second power rises with the published thrust in the same order, from 330 W on the lightest 12N14P record to 1200 W on the MN501-S KV240, so a candidate whose power sits far outside that progression for its thrust is worth inspecting before it goes on the shortlist.
Electrical integration and the pack
The bus is itself a decision, because it sets the pack mass and the ESC rating at the same time as it sets the current the winding carries at the hover point. In this group the choice is effectively between the records published for 6S or below, from 330 W to 760 W of 180 second power, and the records published for 6-12S or 12S, at 1120 W and 1200 W. A low KV on a high bus lowers the hover current for a given shaft power, which lowers copper loss and extends the time the same pack can sustain the aircraft, and it pays for that with a heavier pack and a higher-voltage ESC. This is the step where the UAV motor internal resistance column decides a close call, and it is also the step where the 180 second figure should be used only as a margin signal between candidates of similar duty.
Mechanical envelope and the records
Only after the duty, the bus and the winding have narrowed the list does the mounting side of the decision come into play, and by then the candidate set is usually short enough for clearance, shaft and cable routing to settle it. The mass column is read against the pack budget at this step rather than as a quality score, and the no-cable figure is used where the record publishes one, on three of the seven models here, because that is the mass the airframe structure carries. Where a record does not carry a field the build depends on - no-load current on four of the seven, a no-cable weight on four - the honest move is to put the question to the manufacturer’s documentation rather than to infer the value from a neighbouring model.
The three steps applied to this group give a shortlist rather than an answer:
- Small camera platforms and sub-2 kg airframes. The MN4006 KV380, MN3110 KV470 and MN3510 KV360 are the 3-6S and 4-6S records at 68 g to 117 g, and their published thrust of 1220 g to 2309 g suits the light end of the duty on a small pack.
- Mapping and inspection platforms in the 2-5 kg band. The MN5008 KV340 and the MN4014 KV400 are separated by 36 g of mass, 21 mΩ of resistance and a 6S against a 4-8S bus window, and the choice between them follows from how much freedom the build wants in its pack voltage.
- Heavy multirotor and VTOL lift roles in the 5-10 kg band. The MN501-S KV240 and the MN6007 II KV160 are the 6-12S and 12S records, and the MN6007 II KV160 publishes the highest thrust in the set at 6419 g on the lowest KV.
Frequently asked questions
QHow long can a long-endurance UAV stay airborne on one pack?
There is no universal hour figure, because endurance is a division rather than a specification: the energy the pack can deliver divided by the electrical power the aircraft needs to hover. The hover power is set by the all-up mass and the disk area under the propellers, and the motor enters it only through the thrust per watt at that point and through the thermal derating that follows from running warm. That is why the published records here carry thrust, resistance and 180 second power rather than a flight time, and why a mission profile is the honest way to state an endurance requirement instead of a single number. Where the manufacturer publishes thrust per watt across a throttle range, the part-throttle end of that curve is the part a long flight uses.
QDoes a lower KV mean longer flight time?
Not on its own. KV is a ratio between shaft speed and applied volts, not a measure of efficiency, so a low KV is only an advantage when it is paired with a larger propeller and a bus voltage that together place the motor at an efficient operating point. A low-KV motor on a small, fine propeller turns it too slowly to make useful thrust; the same motor on a large, coarse propeller at the right bus turns it at the speed that propeller wants and draws less current for the same shaft power. In this group the KV figures fall from 470 KV on a 3-6S record to 160 KV on a 12S record, and the two ends reach comparable shaft speeds from very different voltages. The KV figure is a match to the propeller and the pack rather than a quality of its own.
QHow is the 180 s power figure read against a long mission?
It is read as a thermal window and as a margin signal, not as a working point. The figure describes the power the motor can absorb for 180 seconds before its winding reaches the limit set by its insulation class and its mounting, and it is published at the manufacturer’s own test condition rather than at a hover condition. A long mission runs far below that figure for most of its duration, so the number is useful for comparing how much current two candidates of similar duty can carry before the limit is reached, and how much margin one of them has if the hover point moves upward. It is not the figure a pack energy budget is divided by, because the conversion from stored energy to flight time runs through the thrust per watt at the hover point instead.
QCan one motor cover both a VTOL lift and a cruise role?
It can, and the records that do it are the ones with a wide cell-count window. The two roles are two operating points - a high-thrust, short-duration lift and a low-thrust, long-duration forward flight - and covering both with one motor is a compromise that needs a bus the motor can tolerate at the lift point and a KV that keeps the cruise point efficient. In this group that points at the 6-12S MN501-S KV240 and the 12S MN6007 II KV160, which publish the widest bus window and the highest thrust respectively. Whether a specific airframe can be flown that way depends on the manufacturer’s thrust and efficiency data for that propeller at that voltage, so the figures for the chosen propeller are the ones to check before committing to a single-motor layout.
Official resources
T-Motor publishes an official product page for each unit with its specification panel and test data, and those pages remain the source of truth for every figure quoted in this guide - for example the MN5008 KV340 product page, the MN501-S KV240 product page and the MN6007 II KV160 product page. The resistance, cell count, thrust, power and mass figures in the table above are the values those pages publish for each model. A hover-current figure at a specific propeller and voltage, a thermal assumption behind the 180 second figure, or a no-load current for a model whose record does not carry one is a question for the manufacturer’s documentation rather than a value that can be derived from the specification panel.
Where to go next
For shortlisting rather than reading, three tools on the platform do the work in sequence. Explore the full UAV Motors category to see the seven records here alongside the heavy-lift and agricultural models, use Select to narrow by cell count, mass and published power, then place candidates against each other in Compare Products. The Long Endurance UAV application page holds the same duty with its own filter attributes.
Three further articles carry the parts of this subject that a long-endurance selection does not settle. UAV Motors: Matching KV, Thrust and Mass to Your Airframe covers the broader aerial propulsion picture, including the U-series records for larger lift duties that sit outside the MN series compared here. BLDC Motors for Fixed-Wing Model: Matching KV, Propeller and Cruise Power takes the same chain of propeller, KV and cell count and applies it to a wing-borne aircraft, where the operating point is a cruise rather than a hover. Heavy-Lift Drone Motors: Three T-Motor Options from 2.85 kg to 101 kg Thrust covers the lift end of the same duty, where airframes are specified against sustained thrust at multi-kilogram scale.
The short version: fix the propeller and the all-up mass first, because the propeller sets the shaft speed the motor has to reach and the mass sets the hover power it has to produce; match the KV to the bus the airframe can carry second, because KV only becomes a shaft speed once a voltage is attached to it and the bus is what decides the current; and read the winding against the hover current last, because the 180 second power figure is a thermal window rather than a rating. Within this group that sequence separates the 3-6S and 4-6S records from the two mid-band 6S and 4-8S models and from the 6-12S and 12S pair before any individual model is weighed against another.