Every BLDC motor datasheet reduces to one picture: a torque-speed curve, a line that falls as speed rises. The same picture carries two numbers that are routinely confused — continuous torque, which a motor can hold while it stays inside its thermal rating, and peak torque, which it can deliver for a short window and no longer. Telling the two apart is a matter of reading the torque-speed curve the way it was drawn: as an electrical boundary with a thermal question attached. This piece follows that line through six CubeMars modules, from a 64:1 geared joint actuator down to a direct drive gimbal motor, and sets out what the curve promises, what it leaves unstated, and how to interrogate the numbers behind it.
What a Torque-Speed Curve Shows
A torque-speed curve plots output torque against rotational speed. Torque sits on the vertical axis, speed on the horizontal axis, and the working region of the motor lies under a line that starts high on the left — low speed, high torque — and falls to the right until it crosses the speed axis at the no-load speed. Every point beneath the line is, in principle, a combination of torque and speed the motor can operate at. The line itself is the boundary, and everything a selection engineer does with a datasheet starts from reading that boundary correctly — which is what the rest of this piece practises on the torque-speed curve rows of six real modules.
Two axes and two limits
Two separate limits shape the picture. The first is electrical. As the rotor spins faster, the back electromotive force generated in the windings rises, the voltage headroom left to drive current into the phases shrinks, and the torque the drive can maintain falls. That is the origin of the downward slope. The second limit is thermal. Current flowing through copper resistance dumps heat into the windings; a gearbox adds its own friction losses; and each component has a temperature it must not exceed for the materials — insulation, magnets, lubricant — to survive. On a torque-speed curve only the first of the two limits is drawn. The published continuous torque rating describes the torque a module is specified to sustain under the manufacturer stated operating and thermal conditions: electrical limits constrain the torque available at a given speed, thermal limits constrain how much of that capability can be sustained over time, and on an integrated actuator, gearbox losses and drive or component limits shape the usable continuous region as well. That row is what separates a figure a joint can lean on all day from one it can only visit.
A torque-speed curve drawn from the electrical limit alone is therefore an optimistic document. It answers what the drive can force the motor to do; it does not answer how long the motor can keep doing it. The thermal half of the answer lives in separate rows — rated current, temperature rise, duty cycle — and in the gap between the continuous torque figure and the peak torque figure. Reading a torque-speed curve means reading both halves together, and the second half is the one the line itself hides.
Why the line slopes downward
The slope of a torque-speed curve is not a weakness of the motor; it is a consequence of a fixed bus voltage. At standstill, back electromotive force is zero, so the drive does not have to overcome a speed-generated voltage. The current and torque reachable there are still constrained by the controller, the winding resistance, the drive current limit and the operating conditions. As speed rises, back electromotive force consumes more of the supply voltage, less is left to drive current, and available torque falls roughly linearly until the two voltages balance and no current remains: that crossing point is the no-load speed. Change the supply voltage and the whole line moves with it, which is why the same motor can publish several different torque-speed curves on one datasheet.
The RI80 V2.0 frameless inrunner shows the effect across three bus voltages. The published no-load speeds run 1480 rpm on 24 V, 2220 rpm on 36 V and 2960 rpm on 48 V — the same stator and rotor drawn as three torque-speed curves, each one stretched further along the speed axis as the supply rises. The published rated speeds move the same way: 1135, 1785 and 2430 rpm. A module specified against the 24 V curve will not reach the speeds promised by the 48 V curve, and a torque-speed curve read without its bus voltage is half a document.
Continuous Torque vs Peak Torque: Where the Line Sits
Continuous torque is the figure a motor sustains while its temperature settles rather than climbs — the load it can carry for the full working session of a machine within its thermal rating. Peak torque is a transient allowance: the torque available for the short interval in which a joint accelerates, a leg pushes off, a gripper catches a load. The two figures are two readings of the same torque-speed curve at different exposure times, and conflating them is the most common sizing error in joint design. A module sized on peak torque will overheat when the load is continuous; a module sized on continuous torque alone may be heavier and slower than the task needs. A torque-speed curve drawn for a robot joint is read against exactly that question: how much of the line is habitable, and for how long.
The peak-to-rated ratio across six modules
Divide the published peak torque row of a torque-speed curve by the published continuous torque row and the six modules compared in this piece land in a narrow band. The arithmetic runs 120 Nm over 48 Nm, which is 2.5, on the AK80-64 KV80; 72 over 24, which is 3.0, on the AK60-39 V3.0; 53 over 18, about 2.9, on the AK10-9 V3.0; 5.5 over 1.8, about 3.1, on the AKE40-6; 4.1 over 1.45, about 2.8, on the RI80 V2.0; and 1.5 over 0.6, again 2.5, on the GL60 II. These are derived ratios, calculated from the published figures rather than published as rows, and across this sample the derived peak-to-rated ratio ranges from about 2.5 to 3.1. The range describes these six modules, not a universal specification band. The ratio depends on the peak current the drive allows, how long that current is permitted to flow, the thermal mass and cooling of the module, the mechanical limits of the gearbox and output stage, and the definitions the manufacturer applies to rated and peak torque. When assessing another module, check those definitions together with any published duration or thermal test conditions rather than treating this range as a pass-or-fail benchmark.
Where the extra peak torque comes from is current, not magnetism. The AK60-39 V3.0 publishes 4.5 A of rated current against 17 A of peak current; the AK10-9 V3.0 publishes 10.7 A against 31.9 A; the AKE40-6 publishes 2.5 A against 8 A. The magnetic circuit does not grow stronger when a module enters its peak zone — the drive simply pushes more current, and for a given winding under comparable conditions copper loss rises approximately with the square of it. Operation at three times the current therefore implies roughly nine times the winding loss, which is why the peak zone is timed and the continuous zone is not. The peak-to-continuous torque ratio should not, however, be read as a direct current ratio: torque constant, rating definitions, drive limits and the side of the gearbox the figures were measured on all differ across the modules compared here. What holds is the direction of the trade — extra torque is bought with extra current, and current is paid for in heat.
The selection consequences of that cost — how much torque a joint actually needs and where the thermal budget goes — are worked through in How to Choose High Torque Robotic Actuator, which treats the high-torque end of the same question from the sizing side.
Rated Torque, Stall Torque, and the Thermal Path
Rated torque and continuous torque are used interchangeably across most datasheets in this class, and for practical selection they can be read as the same claim: the torque at which the module runs in steady thermal state, the flat region of the torque-speed curve a machine can live on. Stall torque is different. It is the torque at zero speed under maximum current — the top-left end of the torque-speed curve — and on a BLDC motor it is a point the windings can occupy only briefly, because zero speed means no convective cooling from the rotor while resistive heating is at its highest. A motor holding stall torque is a heater with a shaft attached. Datasheets that print a stall figure without a duration are printing an electrical boundary rather than an operating point.
Where the heat comes from
Three heat sources sit inside a geared actuator, and each one dominates in a different corner of the torque-speed curve. Copper losses scale with the square of current and dominate at low speed and high torque — the peak zone. Iron losses scale with speed and flux, and they run even when the motor is lightly loaded. Gearbox losses track transmitted torque and ratio, and they land in the housing rather than the winding, which matters because the housing and the winding have different thermal time constants. The thermal path from each source to ambient air — through the stator, the housing, the mounting flange — decides how quickly each of them accumulates. A module bolted to an aluminium frame sheds heat differently from the same module hanging on a printed bracket, and neither condition is visible in the torque-speed curve.
This is the honest limit of curve reading. The published continuous torque figure is measured under the manufacturer test conditions, which usually mean a specified mounting and a specified ambient temperature, and the datasheet rarely restates them. Where the application departs from those conditions, the usable continuous torque figure moves, and the direction is downward. That is also why the continuous torque row, rather than the peak row, is the one that responds to mounting quality.
Bus voltage moves the whole curve
The rated rows change with supply voltage, and the RI80 V2.0 publishes the full picture: 1.45 Nm of rated torque with rated speeds of 1135, 1785 and 2430 rpm against 24, 36 and 48 V. The GL60 II KV28 publishes the same effect as two panels on a single page. At a 16 V working voltage the gimbal motor lists 1 Nm of peak torque and 153 rpm of rated speed; the 24 V panel lists 1.5 Nm and 319 rpm. The two panels report the same motor mass and the same 24N28P arrangement while publishing different rated speed and peak torque figures, which is why the specified supply voltage has to be part of any reading of the published torque-speed curve. Whether the manufacturer test conditions are otherwise comparable is not stated on the page, so the whole of the difference should not be attributed to voltage alone before that is confirmed. When two datasheets disagree about similar motors, the bus voltage the curve was drawn at is among the first things to check.
On a 48 V bus the same physics raises speeds and changes the system picture in ways that reach beyond the motor, and those constraints — supply availability, safety, drive compatibility — are set out in 48 V Robotic Actuators: Models, Performance Benefits, and System Constraints.
Duty Cycle: How Long Peak Torque Lasts
A peak torque figure without a duration is a promise without a clock, and the torque-speed curve itself is silent on time: it shows what the drive can command, and says nothing about how often or for how long. The duration is set by thermal rise: the winding heats toward its limit at a rate that depends on current squared, and the peak zone ends when the temperature gets there. Most module pages in this class do not print one number for it, because the honest answer depends on where the module starts thermally, how it is mounted, and what happens between peak events. Duty cycle is the bridge between the electrical half and the thermal half of a torque-speed curve, and it is where a load profile meets the module limits. What the pages do publish is enough to reason with: the continuous figure as the steady anchor, the current pair as the multiplier on heating, and on some pages measured operating points that describe the sustained zone directly.
Reading a temperature-rise table
The AKE40-6 KV90 page lists measured operating points rather than a drawn curve: 1.5 Nm at 260 rpm, 2 Nm at 233 rpm and 2.5 Nm at 206 rpm. Read together, the three points show sustained torque rising as the speed at which it is reported falls. They describe reported operating performance at those three torque and speed combinations. On their own they are not a complete torque-speed curve, not a peak torque duration specification, and not a duty cycle limit, and the page does not publish the test duration, mounting or ambient conditions behind them. Before the points are set against the published 1.8 Nm continuous and 5.5 Nm peak figures, the definitions and test conditions behind each of those ratings need to be confirmed with the manufacturer. What the page does supply is unusual: measured points rather than a single headline number, from which the sustained part of the torque-speed curve can be reasoned about rather than assumed.
For a machine in motion, duty cycle is gait arithmetic. A quadruped leg asks for high torque during stance and nearly none during swing, so the joint spends a fraction of each stride in the peak zone and the rest cooling — how that budget is drawn across a full gait cycle, and what it does to the torque, speed and thermal limits of the motors, is worked through in Choosing a BLDC Motor for Quadruped Robot: Torque, Speed and Thermal Limits. The same arithmetic governs a manipulator catching a load, an exoskeleton assisting a step change, or any application whose load is a sequence of events rather than a constant. The figure a gait settles on is a continuous torque requirement first and a peak torque requirement second, and only the first of the two is a place a torque-speed curve can be lived on.
Reading a Torque-Speed Curve on Real Datasheets
Specification tables compress the torque-speed curve into rows, and the compression loses context unless the reader knows which side of the gearbox each row is measured on and which bus voltage each row assumes — the two pieces of context a torque-speed curve cannot carry in a table cell. The continuous torque and peak torque rows below are reproduced exactly as published. The six modules span the full spectrum — a deep 64:1 reduction, a mid 39:1, a shallow 9:1, a quasi direct drive 6:1, and two direct drive motors with no stage at all — which makes the table a reading exercise in itself.
Six modules as one specification set
| Model | Rated Torque (Nm) | Peak Torque (Nm) | Reduction Ratio | Rated Speed (rpm) | Weight (g) | Rated Voltage (V) |
|---|---|---|---|---|---|---|
| AK80-64 KV80 | 48 | 120 | 64:1 | 23/48 | 850 | 24/48 |
| AK60-39 V3.0 KV80 | 24 | 72 | 39:1 | 70 | 750 | 48 |
| AK10-9 V3.0 KV60 | 18 | 53 | 9:1 | 235 | 940 | 48 |
| AKE40-6 KV90 | 1.8 | 5.5 | 6:1 | 260 | 140 | 24 |
| RI80 V2.0 KV75 | 1.45 | 4.1 | direct drive | 1135/1785/2430 | 411 | 24/36/48 |
| GL60 II KV28 | 0.6 | 1.5 | direct drive | 319 | 276 | 24 |
Rows as published on each manufacturer product page, with multi-voltage figures reproduced exactly as printed: the AK80-64 publishes one rated speed per bus voltage and the RI80 one per bus voltage step. Rated speeds of the four integrated actuators are output-side figures, taken behind the reduction stage; the two direct drive motors publish motor-side speeds. Model names carry the KV value, so no separate KV column is given. These figures are reproduced from the cited manufacturer pages; rating definitions and test conditions may differ across models, and peak torque is published without a duration on these pages, so the table is a specification comparison rather than a controlled performance benchmark. Confirm the operating conditions and measurement boundaries before using the values for system sizing.
Read down the torque columns and the reduction story tells itself. The AK80-64 publishes 48 Nm continuous and 120 Nm peak from an 850 g housing because a 64:1 planetary stage stands between the winding and the output. The AK10-9 V3.0, a larger and heavier module at 940 g, publishes less torque — 18 Nm continuous and 53 Nm peak — because its 9:1 stage multiplies less and it buys speed instead: 235 rpm of rated output speed against 23 rpm at the deep end of the AK80-64 on a 24 V bus. Neither column is better; they are different points on the same torque-speed curve, chosen for different joints. A knee on a humanoid and a shoulder on a pick-and-place arm want different corners of the picture.
In the field, the AK80-64 and the AK10-9 V3.0 show up in exactly these roles — the case study above pairs them in a rehabilitation research platform, where the deep-ratio module supplies its 48 Nm of continuous torque at the high-load joints and the shallow-ratio module serves where output speed matters. The AKE40-6 covers the wearable end of the same family, and its place in the exoskeleton joint discussion is set out in AKE40-6 KV90 and AKE50-8 KV110: Compact QDD Actuators for Exoskeleton Joints.
When published figures do not self-check
The rated rows of a datasheet should close against each other: multiply rated torque by rated speed and by 0.10472 — the factor converting rpm to radians per second — and the result should land near the published rated power. The AK60-39 V3.0 closes cleanly: its 24 Nm of continuous torque at 70 rpm gives about 176 W, against a published 176 W. The AK80-64 is less tidy. It publishes 220 W of rated power and rated speeds of 23 rpm at 24 V and 48 rpm at 48 V; the arithmetic gives about 116 W at the first point and about 241 W at the second, and the published figure sits between the two bus points rather than matching either. The published rows do not establish whether the rated power figure and both voltage-specific torque and speed points refer to the same operating condition, so the difference should be flagged for verification with the manufacturer rather than attributed to an undocumented test condition or rounded away. The general lesson stands: the numbers behind a torque-speed curve deserve interrogation before a design commits to them, and a row that will not close against its neighbours is a signal, not a typo. Where a figure is ambiguous, the manufacturer documentation for the specific module is the authority.
Reduction Ratio and Reflected Load at the Output
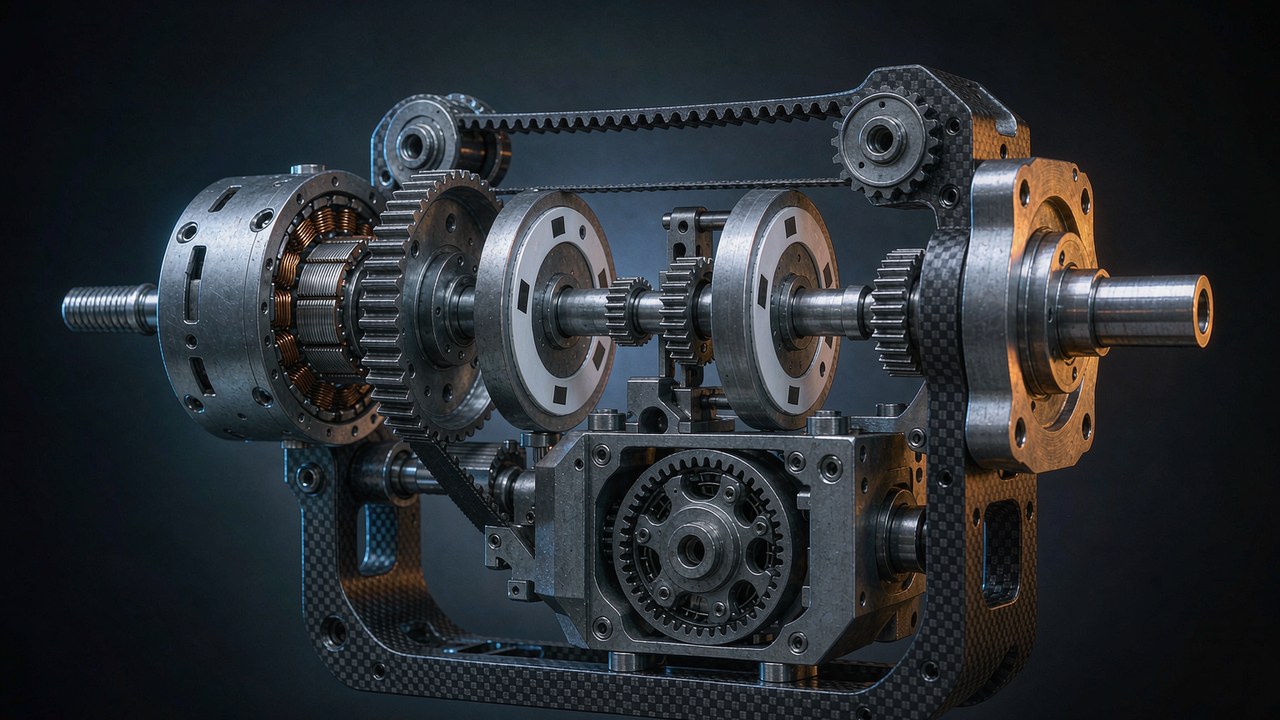
A gearbox trades output speed for torque multiplication, which makes reduction ratio a major factor in where a module sits on the torque-speed curve. The output capability of a module also depends on the motor itself, the drive limits, transmission efficiency and the manufacturer operating ratings, so the ratio is a lever rather than the whole picture. It also imports consequences the curve does not draw: in an ideal gear transmission model, load inertia reflected to the motor side scales with the inverse square of the ratio; the stage adds backlash and friction of its own; and it decides how much of an external force at the output reaches the motor as a disturbance the controller can sense. The five ratios in the table above — 64:1, 39:1, 9:1, 6:1 and none — are five different answers to that trade, each placing the module at a different point on the torque-speed curve, not five quality grades.
What the ratio does to the output
On the integrated actuators, every published speed is an output-side figure, taken behind the stage. The AK80-64 publishes its 48 Nm of continuous torque at 23 rpm on 24 V and at 48 rpm on 48 V; the AK60-39 V3.0 publishes 24 Nm continuous at 70 rpm; the AK10-9 V3.0 publishes 18 Nm continuous at 235 rpm. Comparing those rows is comparing finished joints, and it is the comparison a machine designer actually needs. But when a torque-speed curve is quoted for the bare motor inside the module, the ratio has to be applied before the numbers mean anything at the output, and forgetting that step is among the classic errors of datasheet reading. The same caution runs in reverse for inertia: in an ideal gear transmission model, load inertia reflected to the motor side scales with the inverse square of the reduction ratio, so a 64:1 stage reflects substantially less load inertia to the motor than a 6:1 stage does. Real system dynamics also depend on transmission stiffness, friction and the rest of the drivetrain, which is why quasi direct drive joints feel the load more directly and high-ratio joints feel it less.
The low-ratio end of that trade — what an 8:1 stage buys in backdrivability, reflected inertia and force transparency, and what it costs in torque — is treated in depth in Quasi Direct Drive Actuators: What an 8:1 Ratio Buys You.
Direct drive without a stage
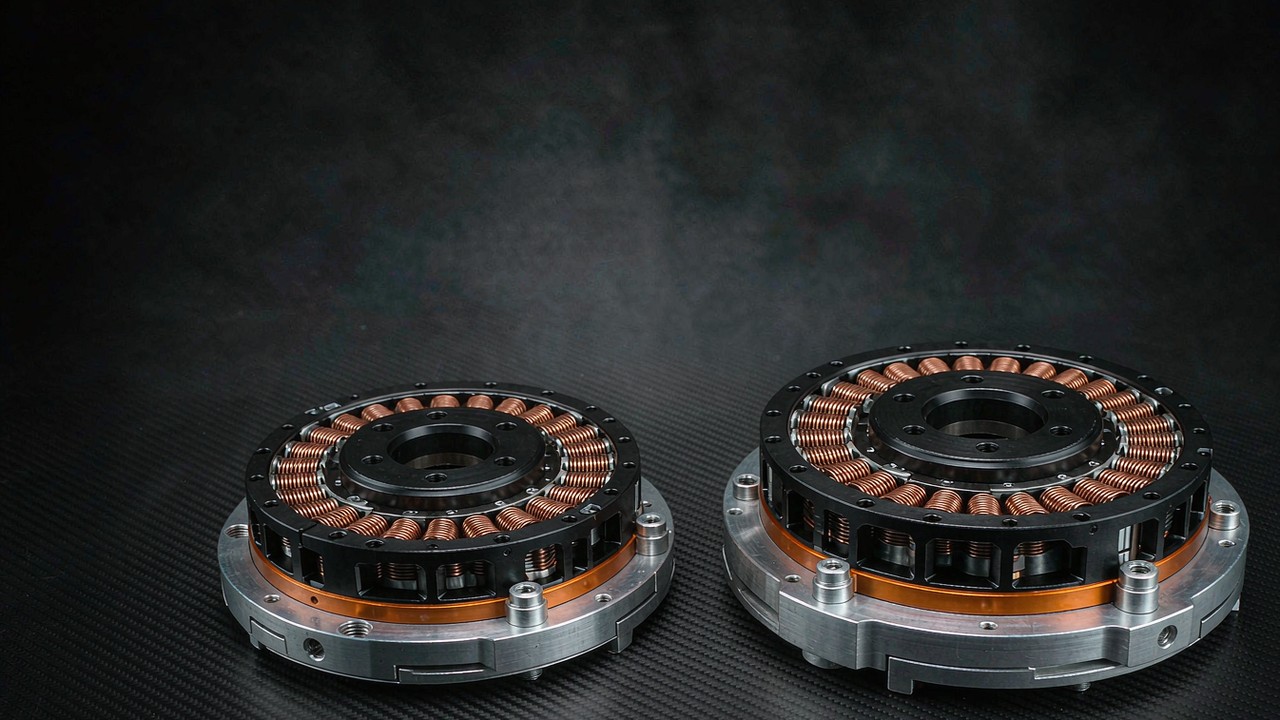
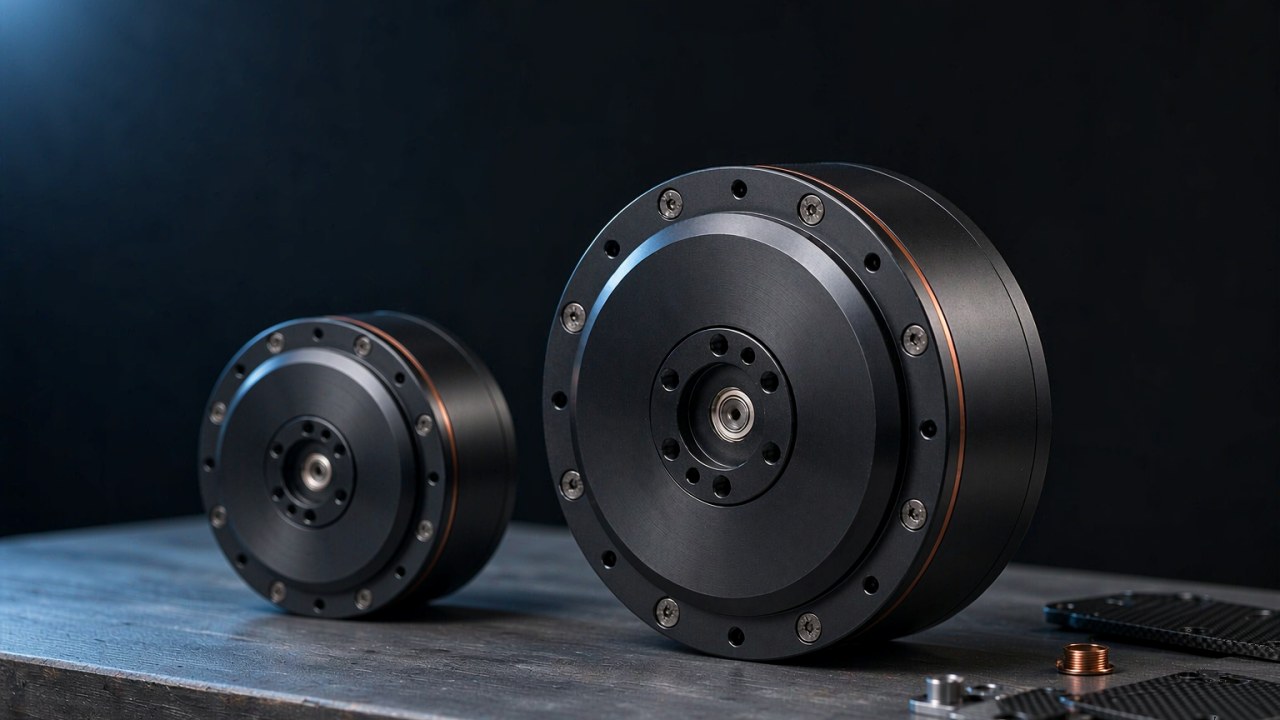
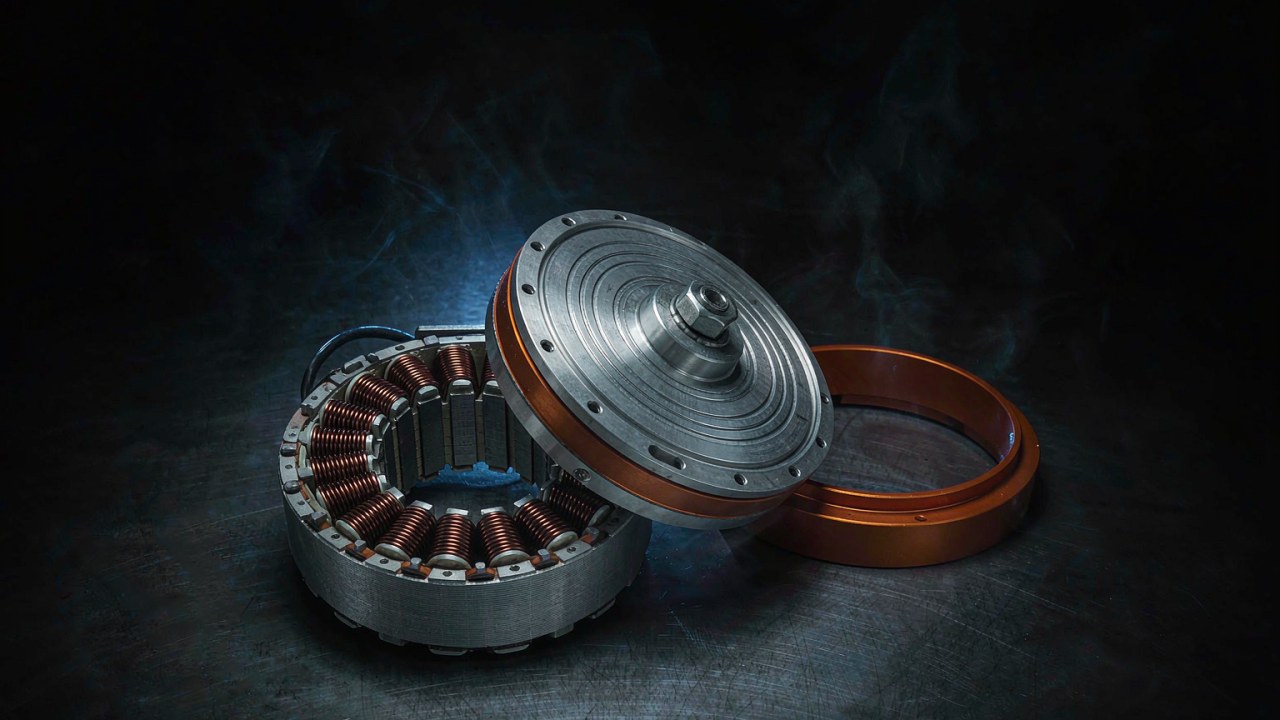
Remove the stage entirely and the curve belongs to the motor alone. The RI80 V2.0 ships as a frameless kit — stator and rotor, no housing, no bearings — and publishes 1.45 Nm continuous and 4.1 Nm peak at motor-side speeds of 1135 rpm and up, depending on bus voltage. The GL60 II is a direct drive gimbal motor specified at 0.6 Nm continuous torque and 1.5 Nm peak torque on its 24 V panel. Those rows describe the published torque capability of the motor; whether a given camera holds steady on a given axis depends on the payload, its centre of mass, the axis configuration, the controller and the operating conditions, and the shape of the usable region of the torque-speed curve should be taken from the manufacturer published curve or test data rather than inferred from the torque ratings alone. Removing the stage does remove the backlash contributed by gear meshing and the inertia reflection through a gear train, while bearing play, structural compliance and the load inertia acting directly on the shaft remain. The cost is torque density: matching 48 Nm continuous without a stage would require a frameless motor of entirely different dimensions, a scaling story told in High Torque Frameless Motor: Where the Torque Comes From. How to select the stator and rotor kit itself — envelope, bore, thermal mounting — is covered in Frameless Torque Motors: Choosing a Stator and Rotor Kit for Robot Joints.
Frequently asked questions
QWhat is the difference between continuous torque and peak torque?
Continuous torque is the figure a motor holds in steady thermal state, for as long as the application runs within its rating. Peak torque is a transient allowance, available for a short interval in which the load spikes, and bounded by temperature rise rather than by the electrical limit alone. Both figures live on the same torque-speed curve, at different exposure times. Across the six modules compared here the derived peak-to-rated ratio sits between 2.5 and 3.1, a range that describes this sample rather than a general specification band.
QHow to read a torque-speed curve on a motor datasheet?
Start with the axes and the bus voltage the curve was drawn at, because the whole line moves with the supply. Read the no-load speed where the line crosses the speed axis, read the torque at the operating speed the application actually uses, and then check the continuous rating and the thermal rows before trusting any point under the line. On an integrated actuator, confirm that the speeds printed are output-side figures taken behind the reduction stage.
QHow long can a BLDC motor hold peak torque?
Only until the winding temperature reaches its limit, which depends on the starting temperature, the current level, the mounting, the cooling and the spacing between peak events. Most pages in this class publish no duration, and without a published duration or thermal test profile the available data may not be sufficient to establish a safe transient window. Where a datasheet draws two boundaries on the torque-speed curve, the peak line sits above the continuous line and neither carries a clock. The AKE40-6 publishes measured operating points — 1.5 Nm at 260 rpm, 2 Nm at 233 rpm and 2.5 Nm at 206 rpm — which describe reported operating performance at those combinations and are not a peak duration specification. Verify the applicable limits against the manufacturer documentation for the specific module and operating conditions.
QWhy is rated torque lower at higher speed?
Two effects can stack. Electrically, back electromotive force rises with speed and reduces the voltage headroom available to maintain torque-producing current, so the torque available along the torque-speed curve falls as speed rises. Thermally, speed-dependent losses, iron losses among them, grow with speed and can add to the copper losses at the same time. Which of the two dominates depends on the motor, the drive, the supply voltage, the cooling and the manufacturer operating limits, and the rated point on a torque-speed curve is set at the stated condition.
QDoes a gearbox change the torque-speed curve?
It rescales the torque-speed curve. Torque at the output is motor torque multiplied by the ratio, speed at the output is motor speed divided by it, and the curve keeps its shape while moving up the torque axis and down the speed axis. Inertia is rescaled the same way: in an ideal gear model, load inertia reflected to the motor side falls with the inverse square of the ratio. What the gearbox adds beyond the rescaling — backlash, friction — is not drawn on the curve but decides how the joint behaves under load. The published speeds of integrated actuators are already output-side figures, so no further division applies.
Reading the curve is one link in a chain of joint decisions. Feedback decides what the controller knows, and the measurement side is covered in Encoder Resolution at a Robot Joint: Bits, Backlash, and Repeatability. The reduction stage decides how torque and inertia translate between motor and load, as set out above. Torque, thermal limit and duty cycle decide how much of the torque-speed curve the application can actually inhabit — the subject of this piece. Modules can be filtered by rated and peak torque across categories in Select and compared side by side in Compare Products, with the integrated range under Robotic Actuators and the bare motors under Frameless Torque Motors.